Parameters for R plot funtion
The plot() function in R is widely used. It actually has numerous paramters to tune.
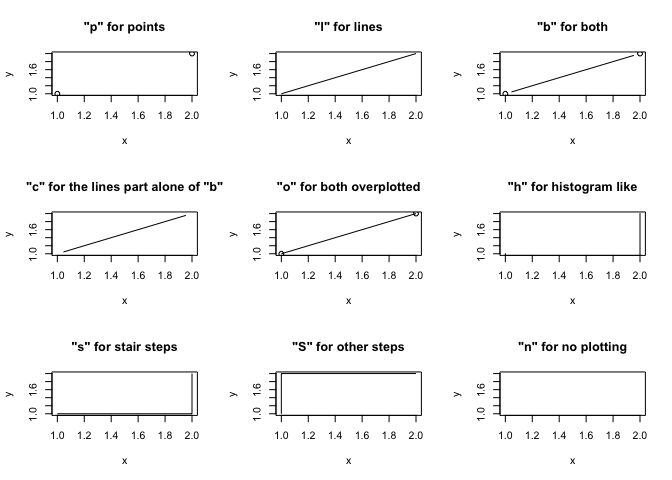
type
layout(matrix(1:9, 3,3,byrow=T))
plot(1:2,1:2,type="p", main="\"p\" for points", xlab="x", ylab="y")
plot(1:2,1:2,type="l", main="\"l\" for lines", xlab="x", ylab="y")
plot(1:2,1:2,type="b", main="\"b\" for both", xlab="x", ylab="y")
plot(1:2,1:2,type="c", main="\"c\" for the lines part alone of \"b\"", xlab="x", ylab="y")
plot(1:2,1:2,type="o", main="\"o\" for both overplotted", xlab="x", ylab="y")
plot(1:2,1:2,type="h", main="\"h\" for histogram like", xlab="x", ylab="y")
plot(1:2,1:2,type="s", main="\"s\" for stair steps", xlab="x", ylab="y")
plot(1:2,1:2,type="S", main="\"S\" for other steps", xlab="x", ylab="y")
plot(1:2,1:2,type="n", main="\"n\" for no plotting", xlab="x", ylab="y")
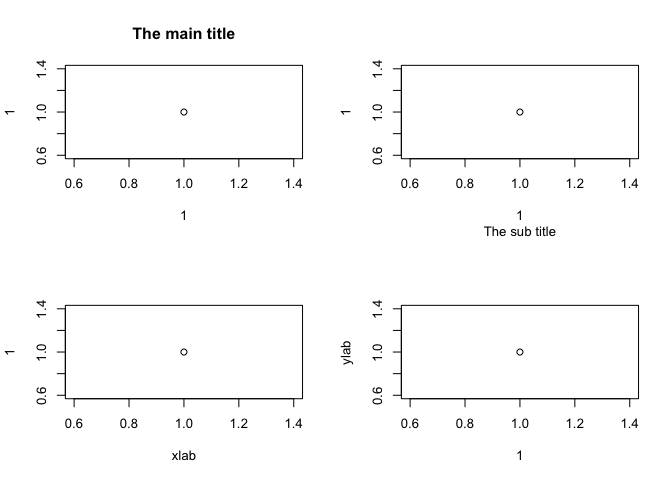
main, sub, xlab and ylab
layout(matrix(1:4,2,2,byrow=T))
plot(1,1,main="The main title")
plot(1,1,sub="The sub title")
plot(1,1,xlab="xlab")
plot(1,1,ylab="ylab")
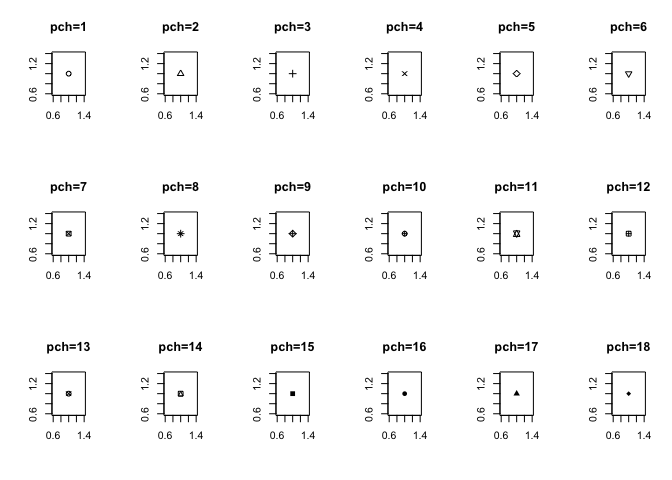
pch
layout(matrix(1:18,3,6,byrow=T))
for(i in 1:18){
  plot(1,1,pch=i,xlab="",ylab="",main=paste("pch=",i,sep=""))
}
Reference
- plot function help page
- par help page
- “Graphic Parameters” quick-R page