P-values under null hypothesis
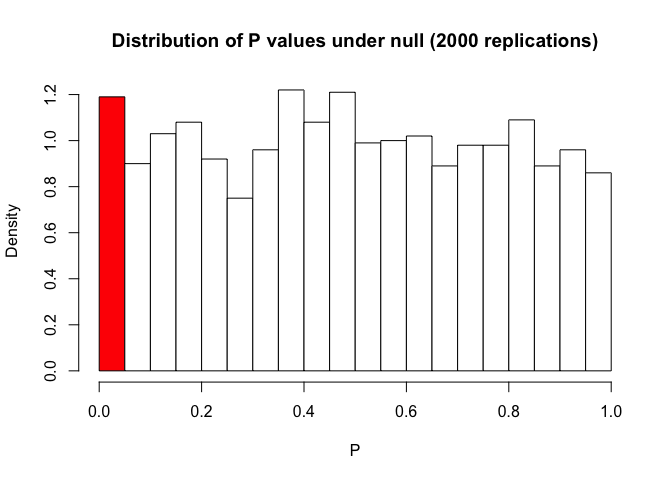
P values are also random variables. The distribution of p values under null hypothesis should be a uniform one.
set.seed(1)
y = rnorm(50)
ps = c()
for(i in 1:2000){
  x = rnorm(50)
  p = summary(lm(y~x))$coefficients[2,4]
  ps = c(ps, p)
}
hist(ps,breaks=seq(0,1,0.05),col=c("red",rep("white",19)), main = "Distribution of P values under null (2000 replications)", freq=FALSE, xlab="P")
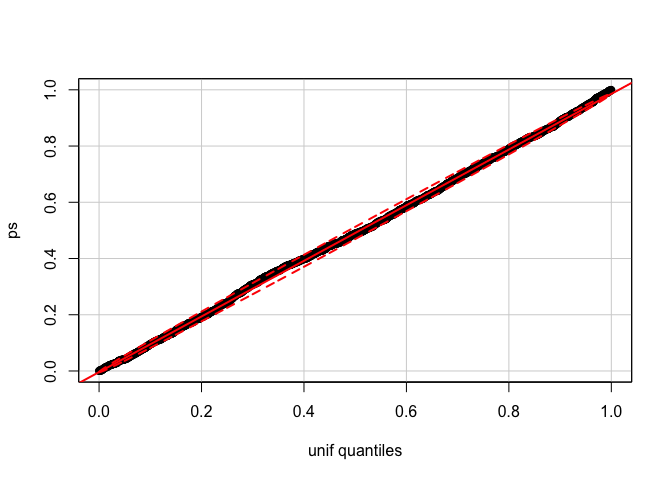
QQ-plot can show the p values follow an uniform distribution.
library(car)
qqPlot(ps, distribution="unif")
Proof
http://vasishth-statistics.blogspot.com.au/2016/04/a-simple-proof-that-p-value.html